- Name Power BI Desktop
- Category Business
- Available on PC
- OS Windows 10 version 17134.0 or higher
- Memory Not specified
- languages Basque, Bulgarian, Catalan, Chinese (Simplified), Chinese (Traditional), Croatian, Czech, Danish, Dutch, English (United States), Estonian, Finnish, French, Galician , German, Greek, Hindi, Hungarian, Indonesian, Italian, Japanese, Kazakh, Korean , Latvian, Lithuanian, Malay, Norwegian (Bokmål), Polish , Portuguese (Brazil), Portuguese (Portugal), Romanian, Russian, Serbian, Serbian (Latin, Serbia), Slovak, Slovenian (Slovenia), Spanish (Spain), Swedish, Thai, Turkish, Ukrainian, Vietnamese
Power BI Desktop for Windows: Empowering Data Insights with Ease
Microsoft's Power BI Desktop for Windows stands out as a powerful, user-friendly tool designed to help users transform raw data into compelling, interactive visual reports. With its intuitive interface and robust features, it caters to both data novices and seasoned analysts, enabling smarter business decisions through data storytelling.
Key Features That Make Power BI Desktop Shine
Seamless Data Integration and Modeling
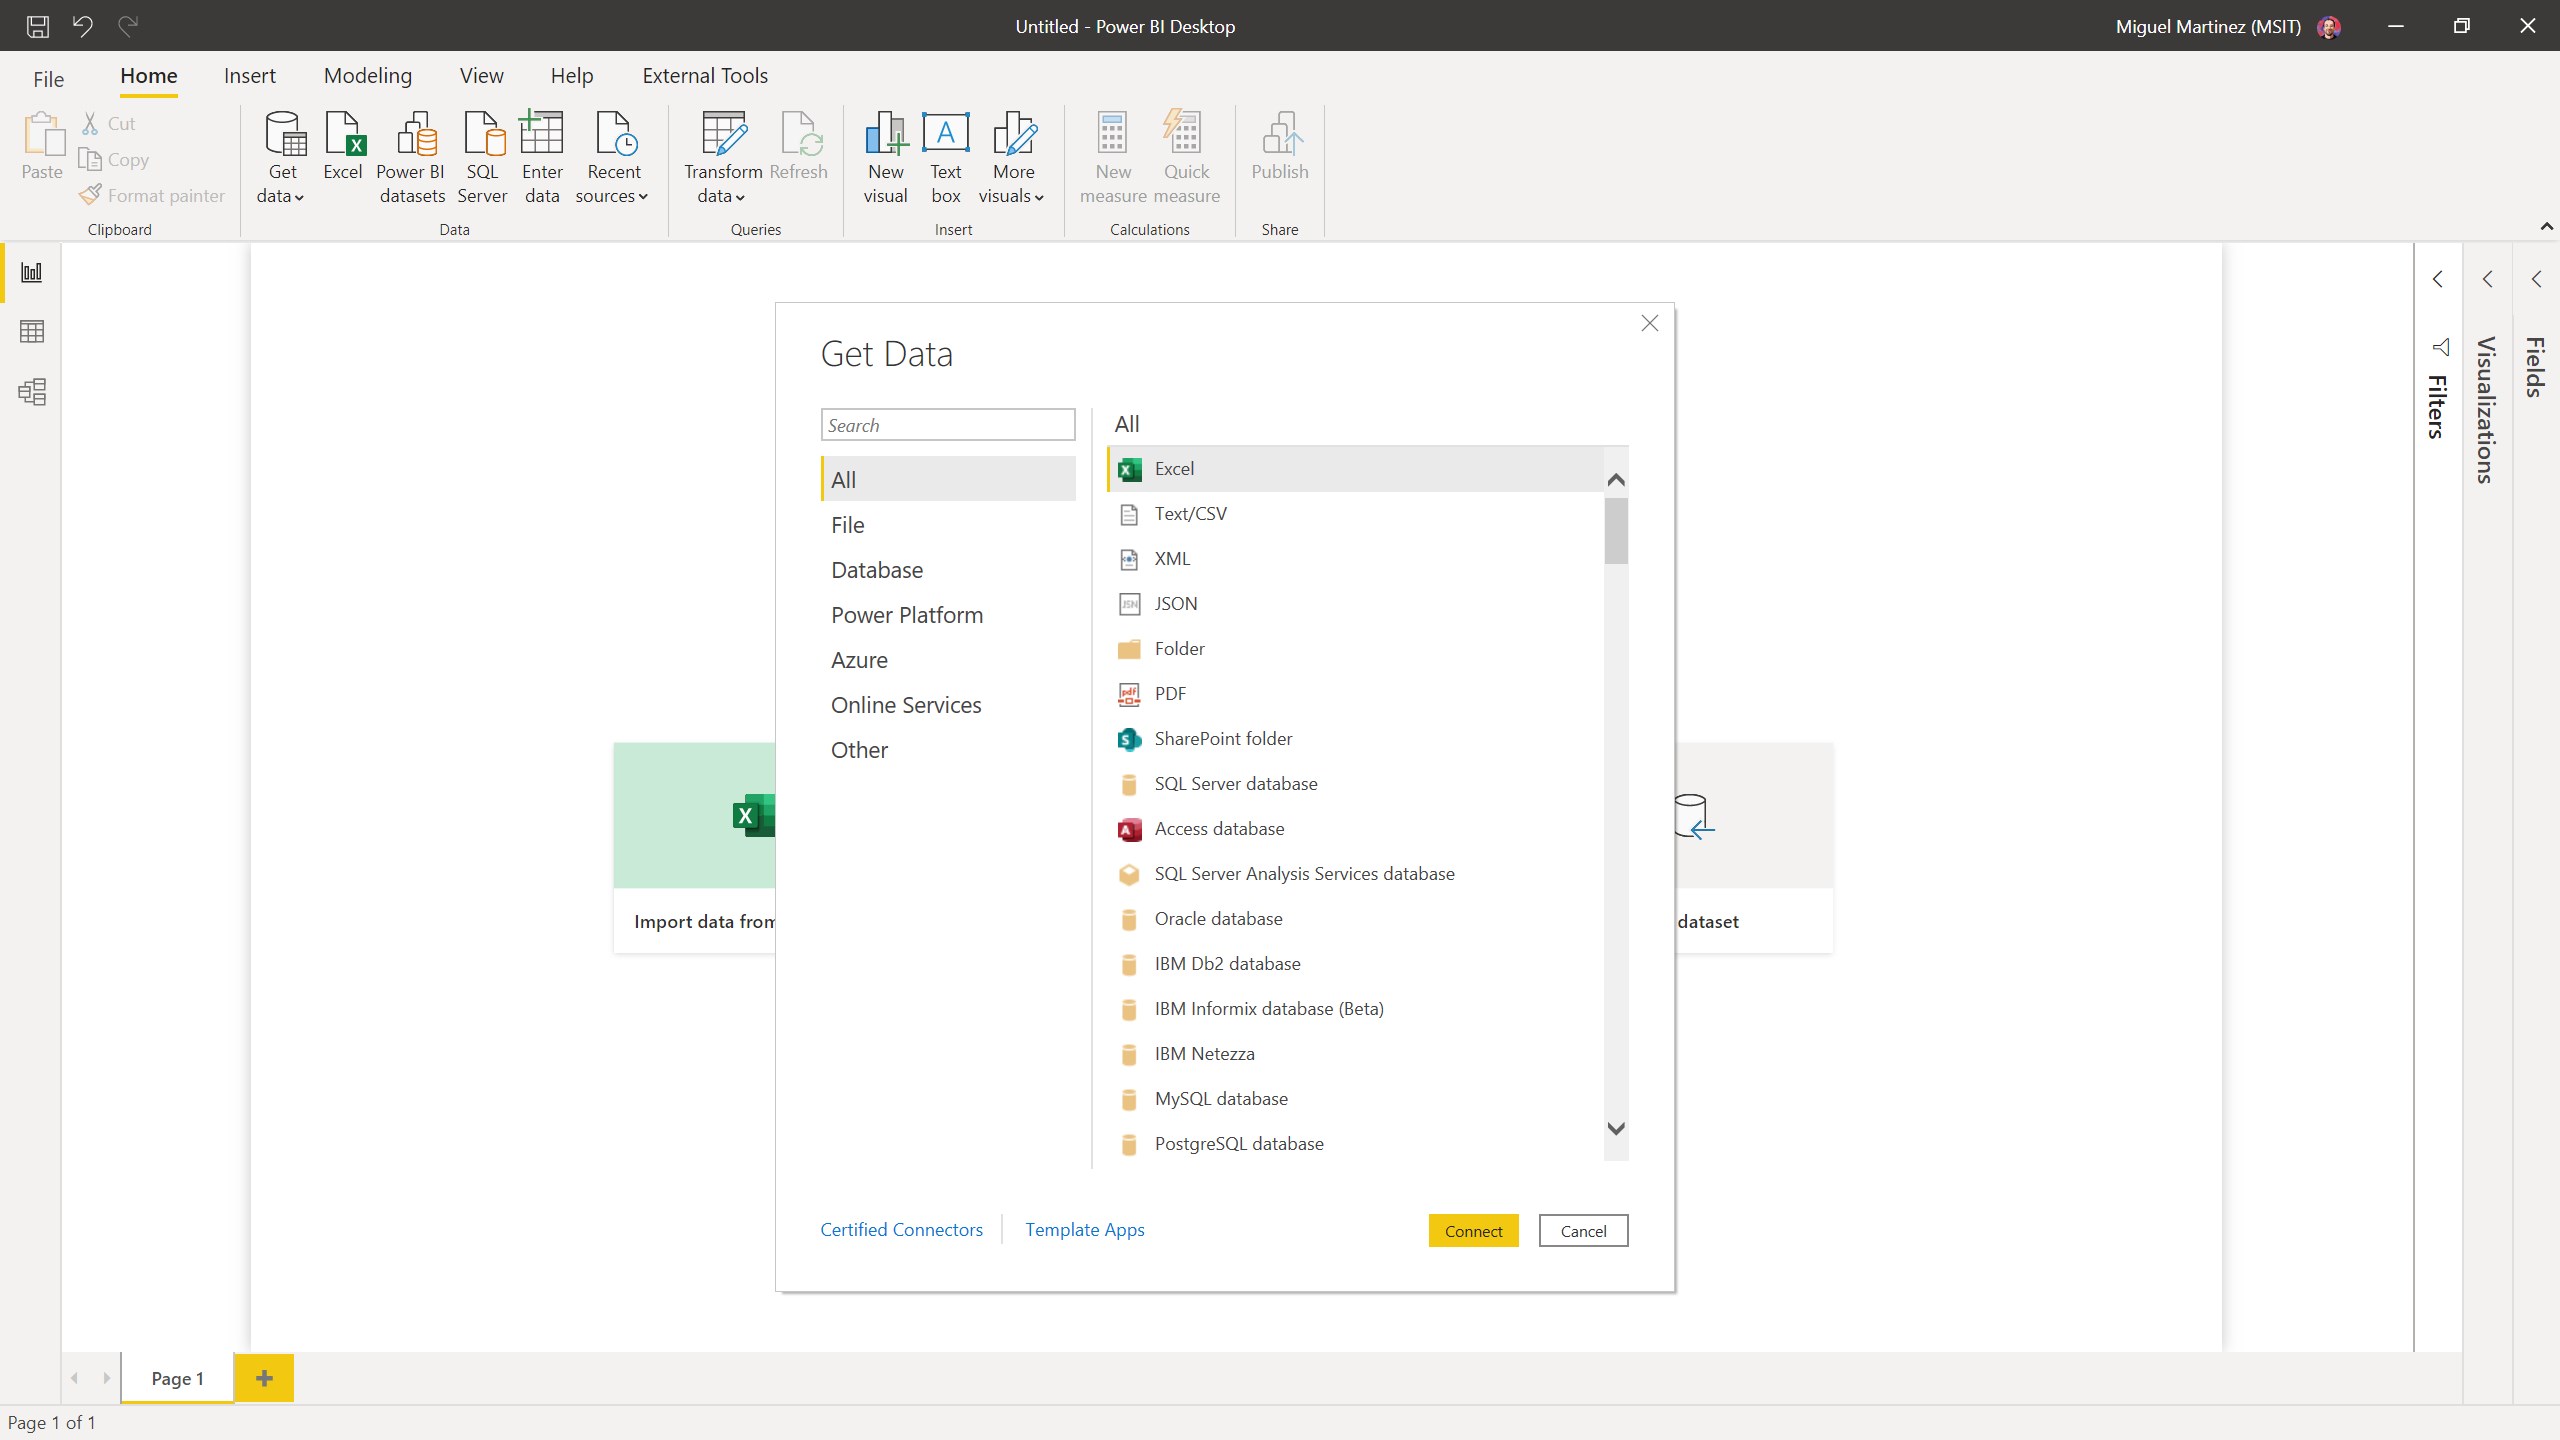
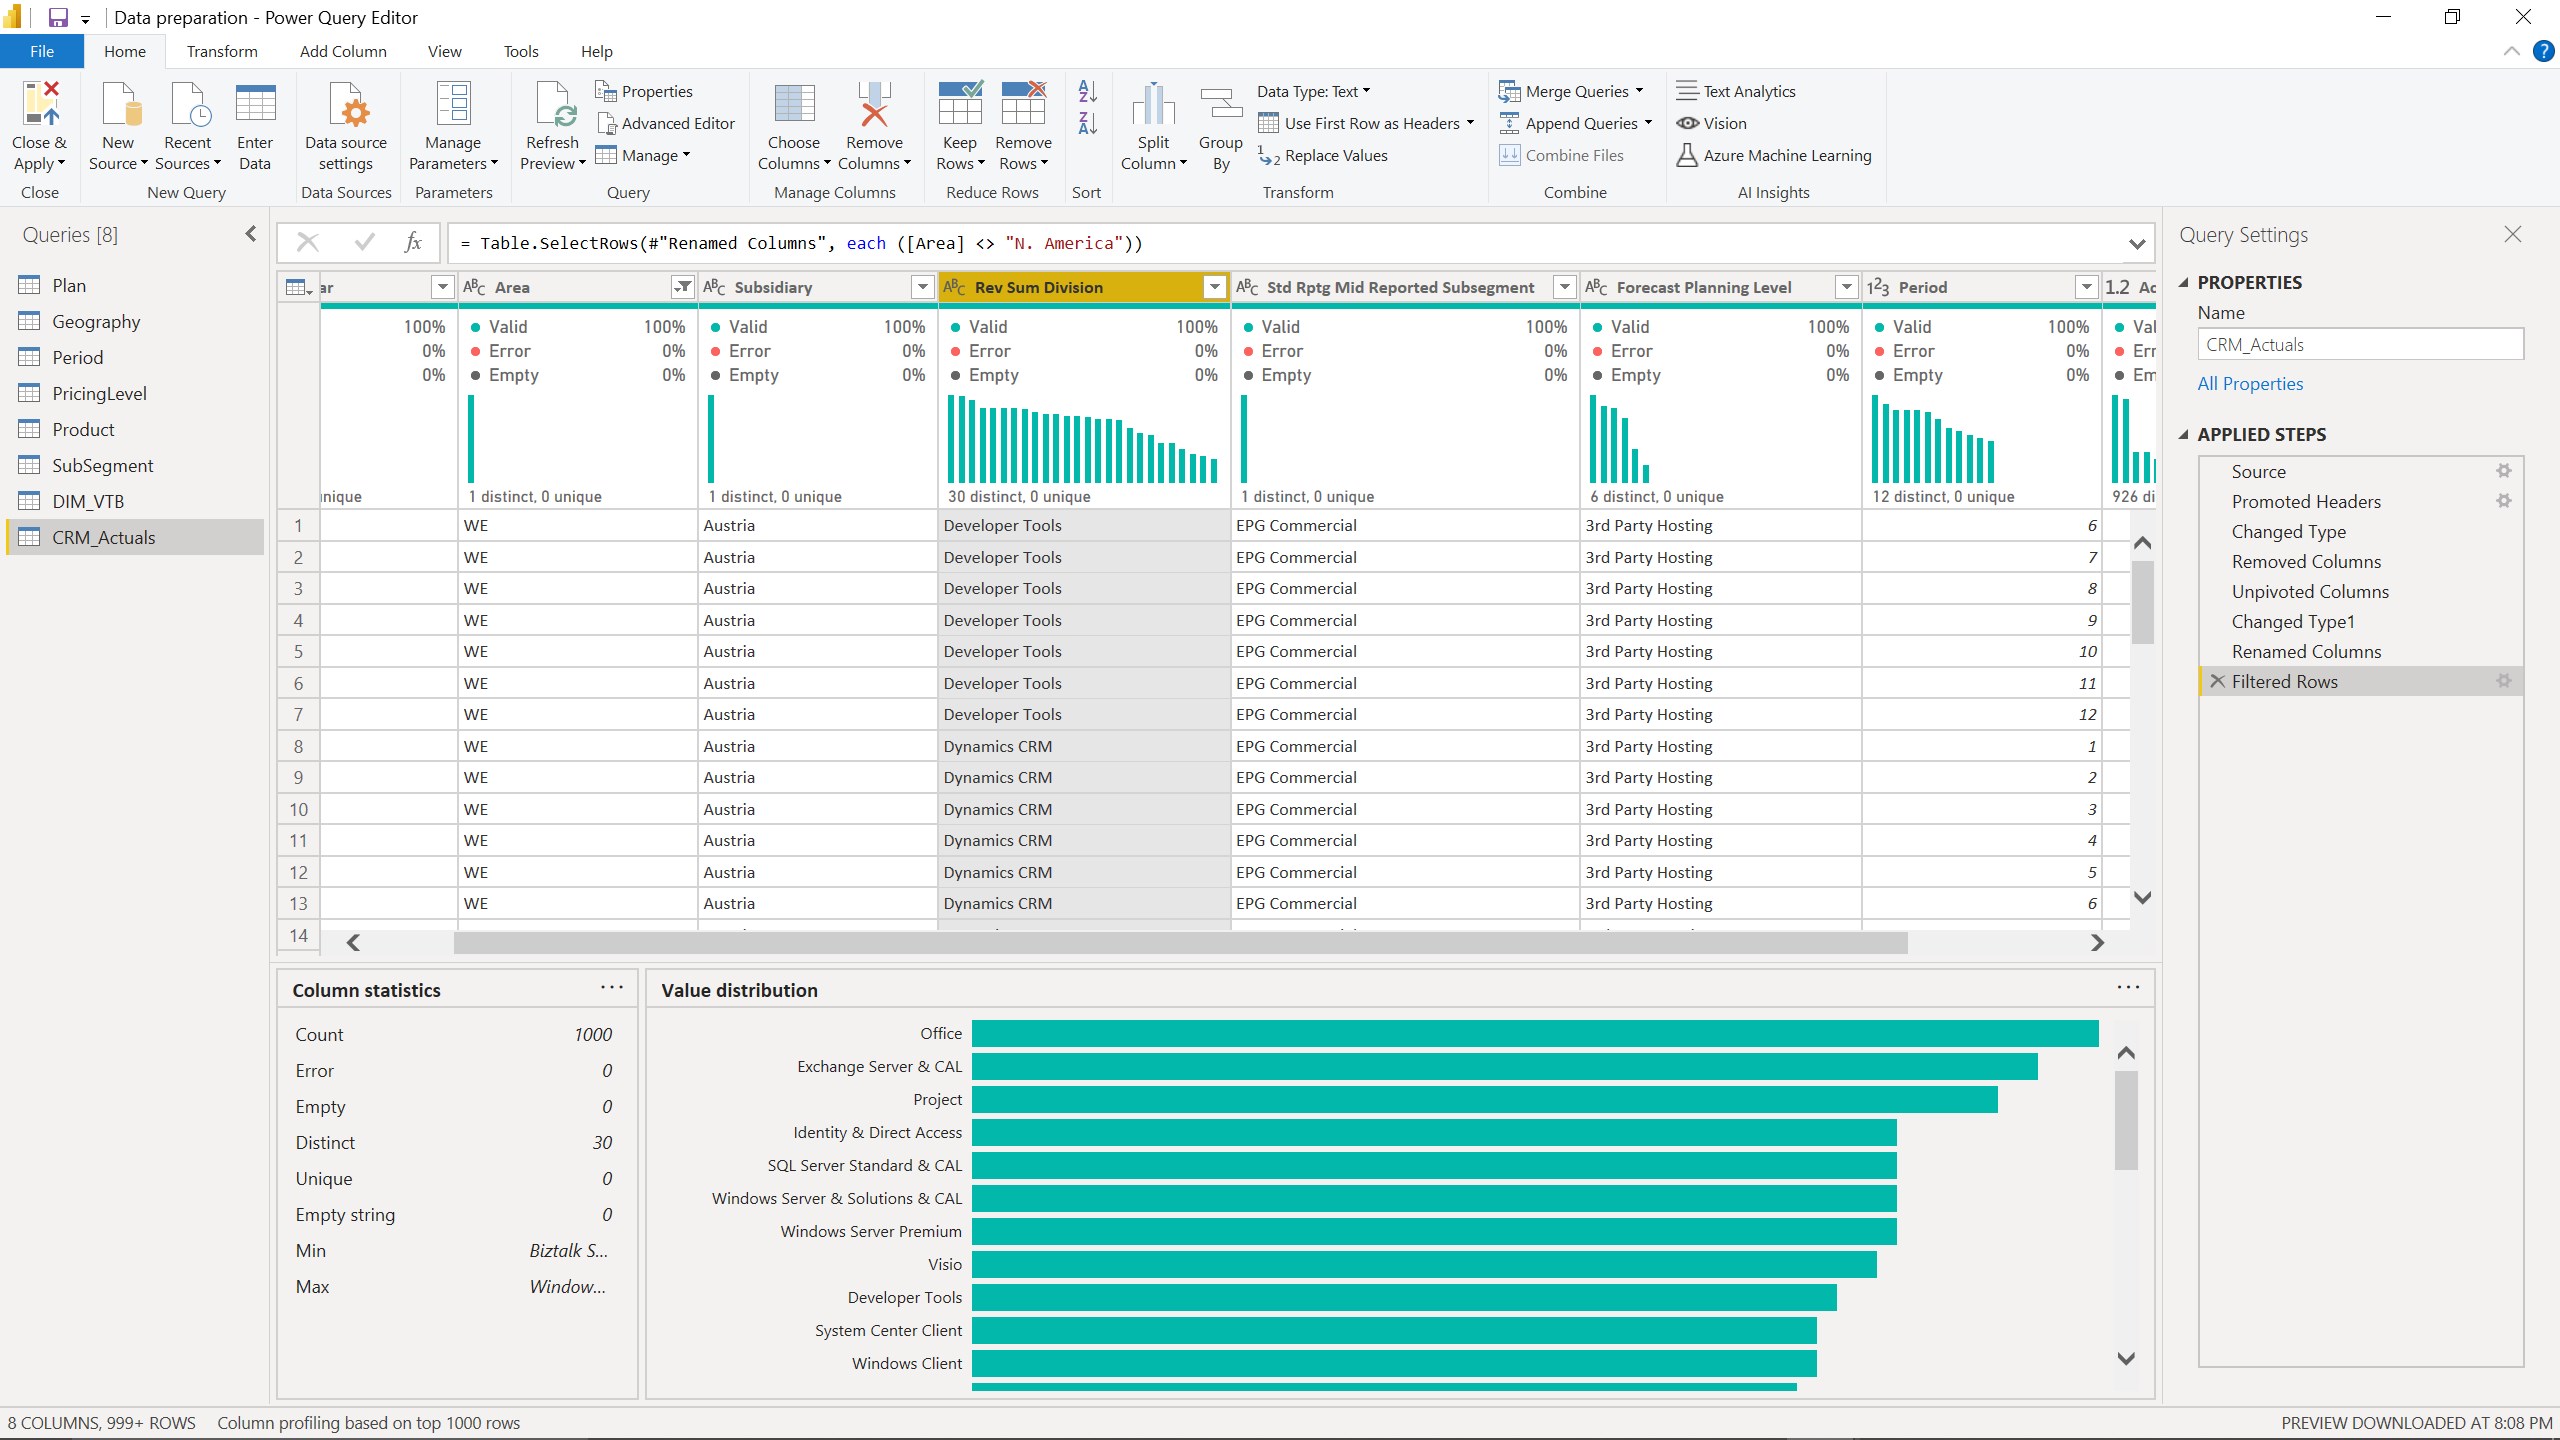
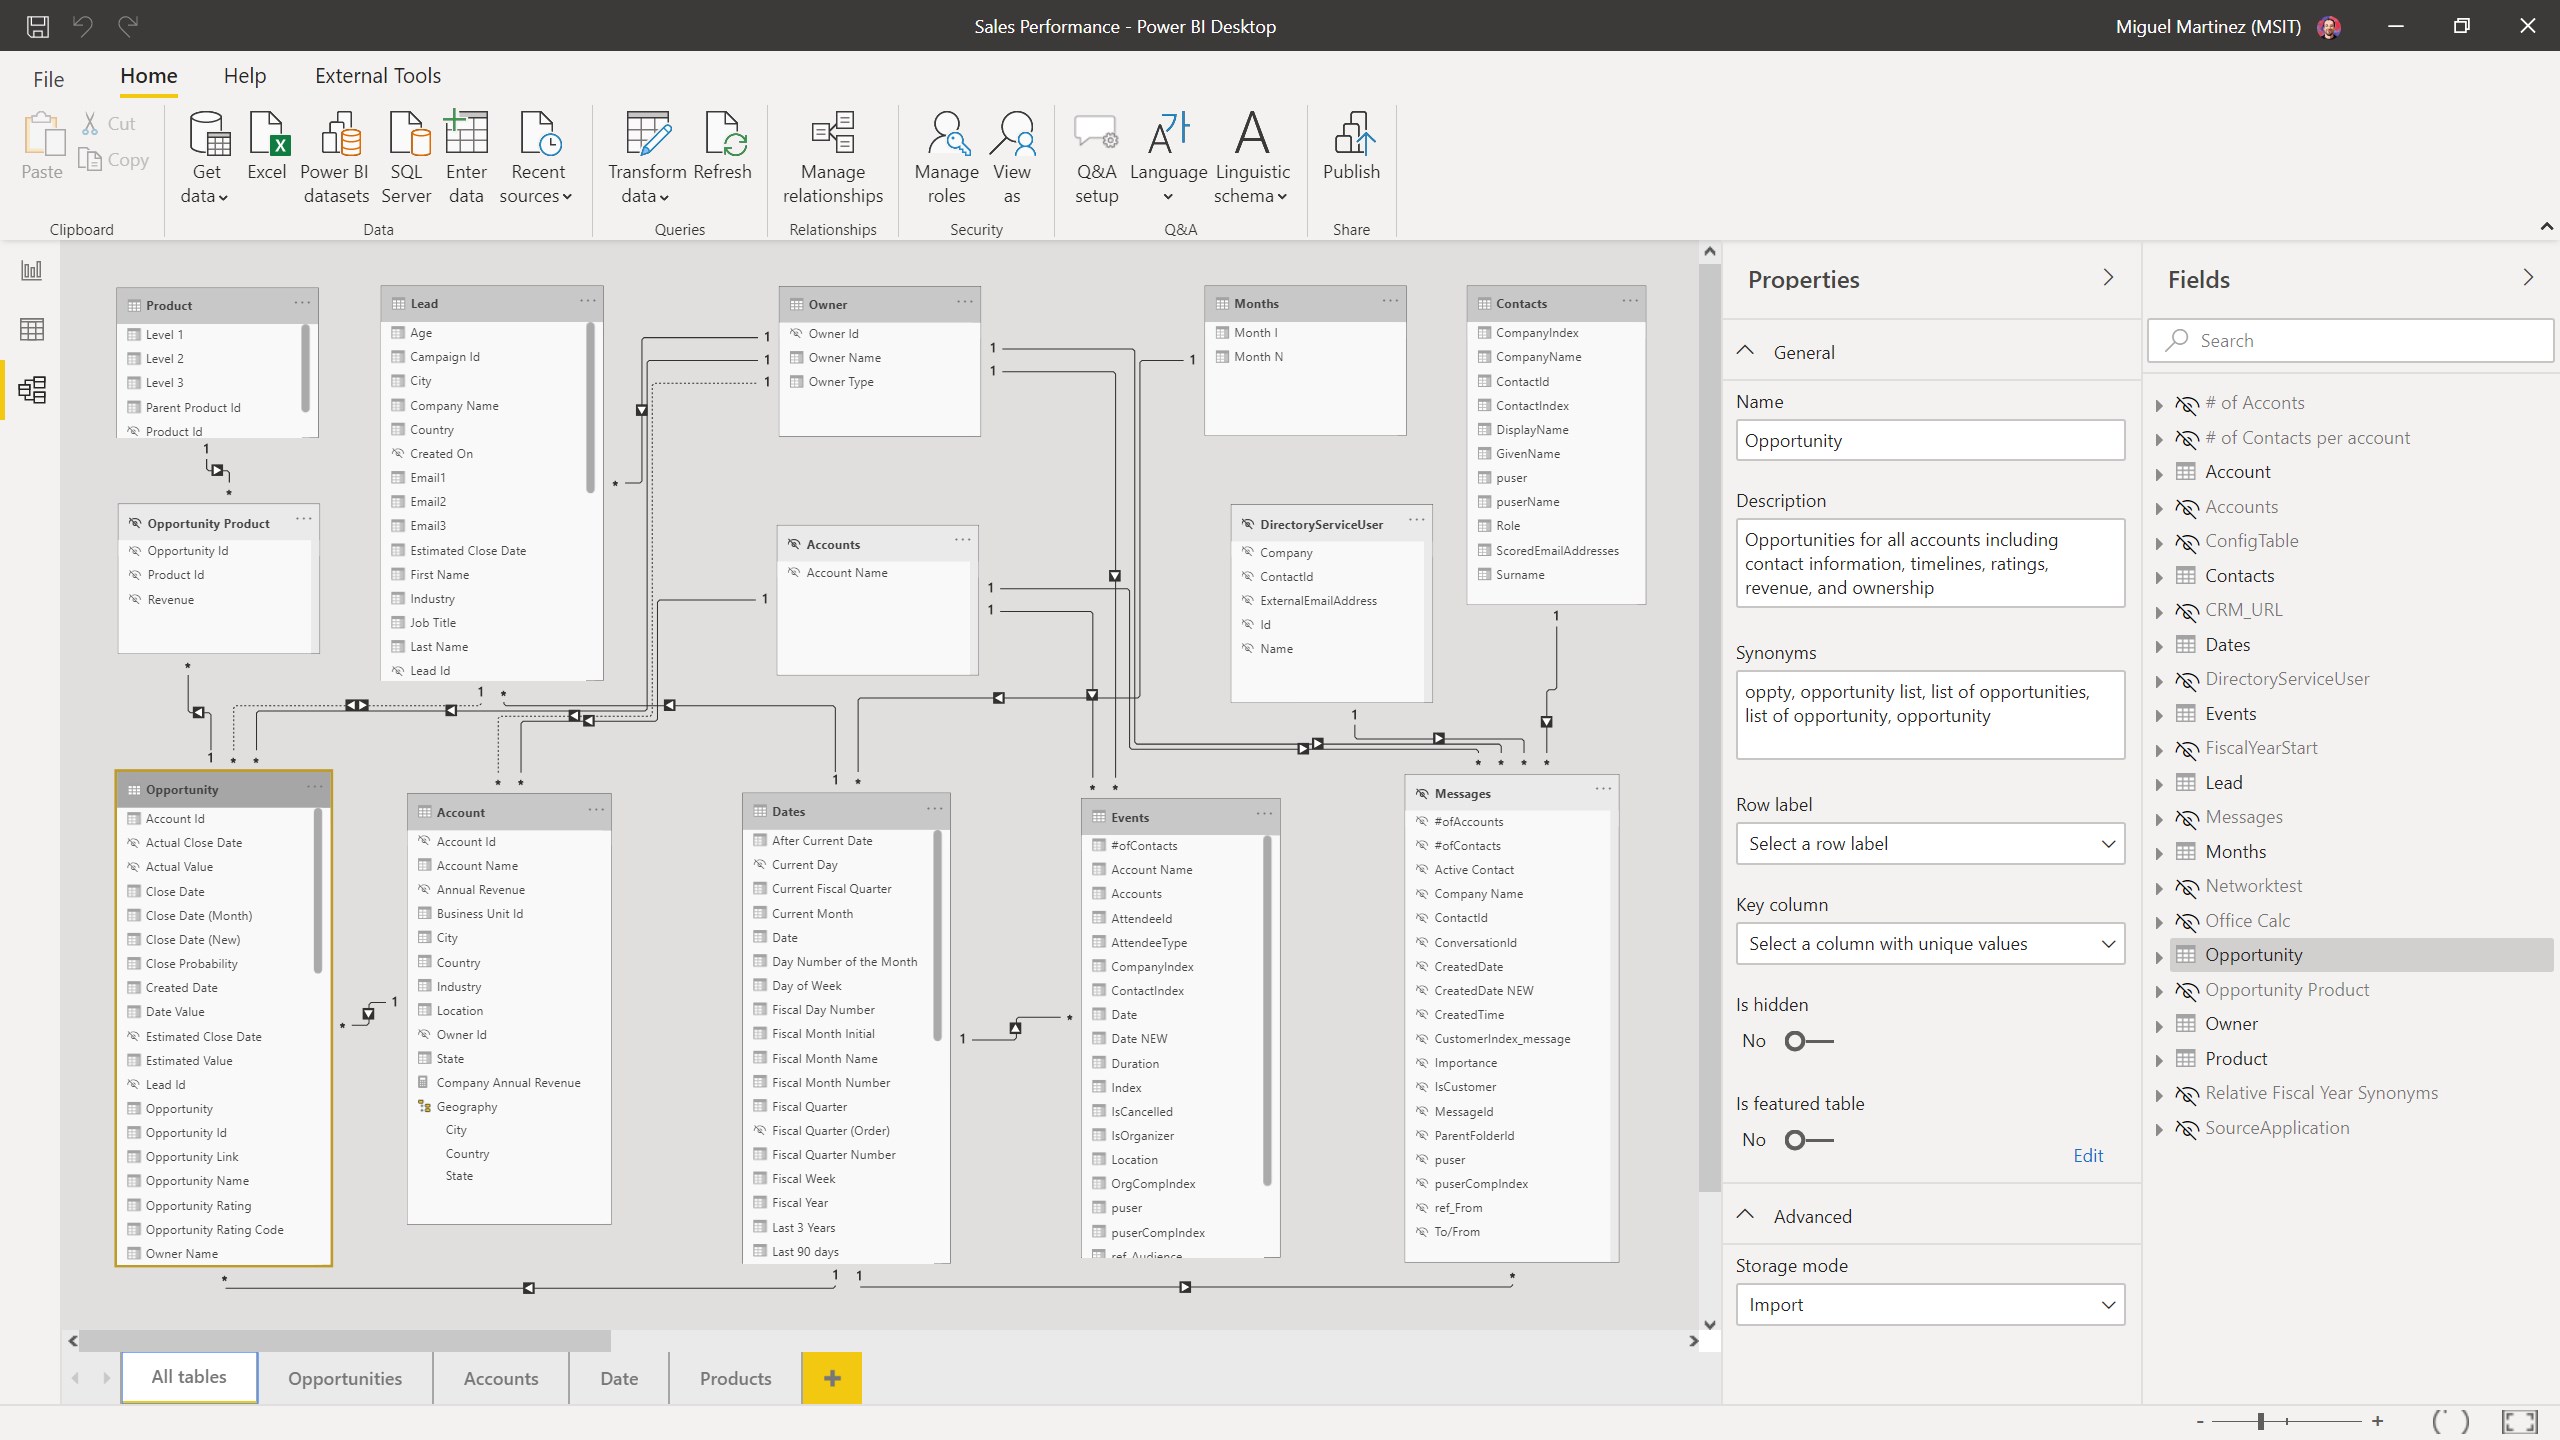
Power BI Desktop excels at connecting to a wide array of data sources — from Excel spreadsheets and cloud services to complex databases. Its drag-and-drop data modeling environment makes it easy for users to shape, clean, and merge data, creating a unified view for analysis without extensive technical know-how. The built-in query editor acts like a digital chef's knife, chopping and blending data slices effortlessly.
Rich Visualizations and Custom Dashboards
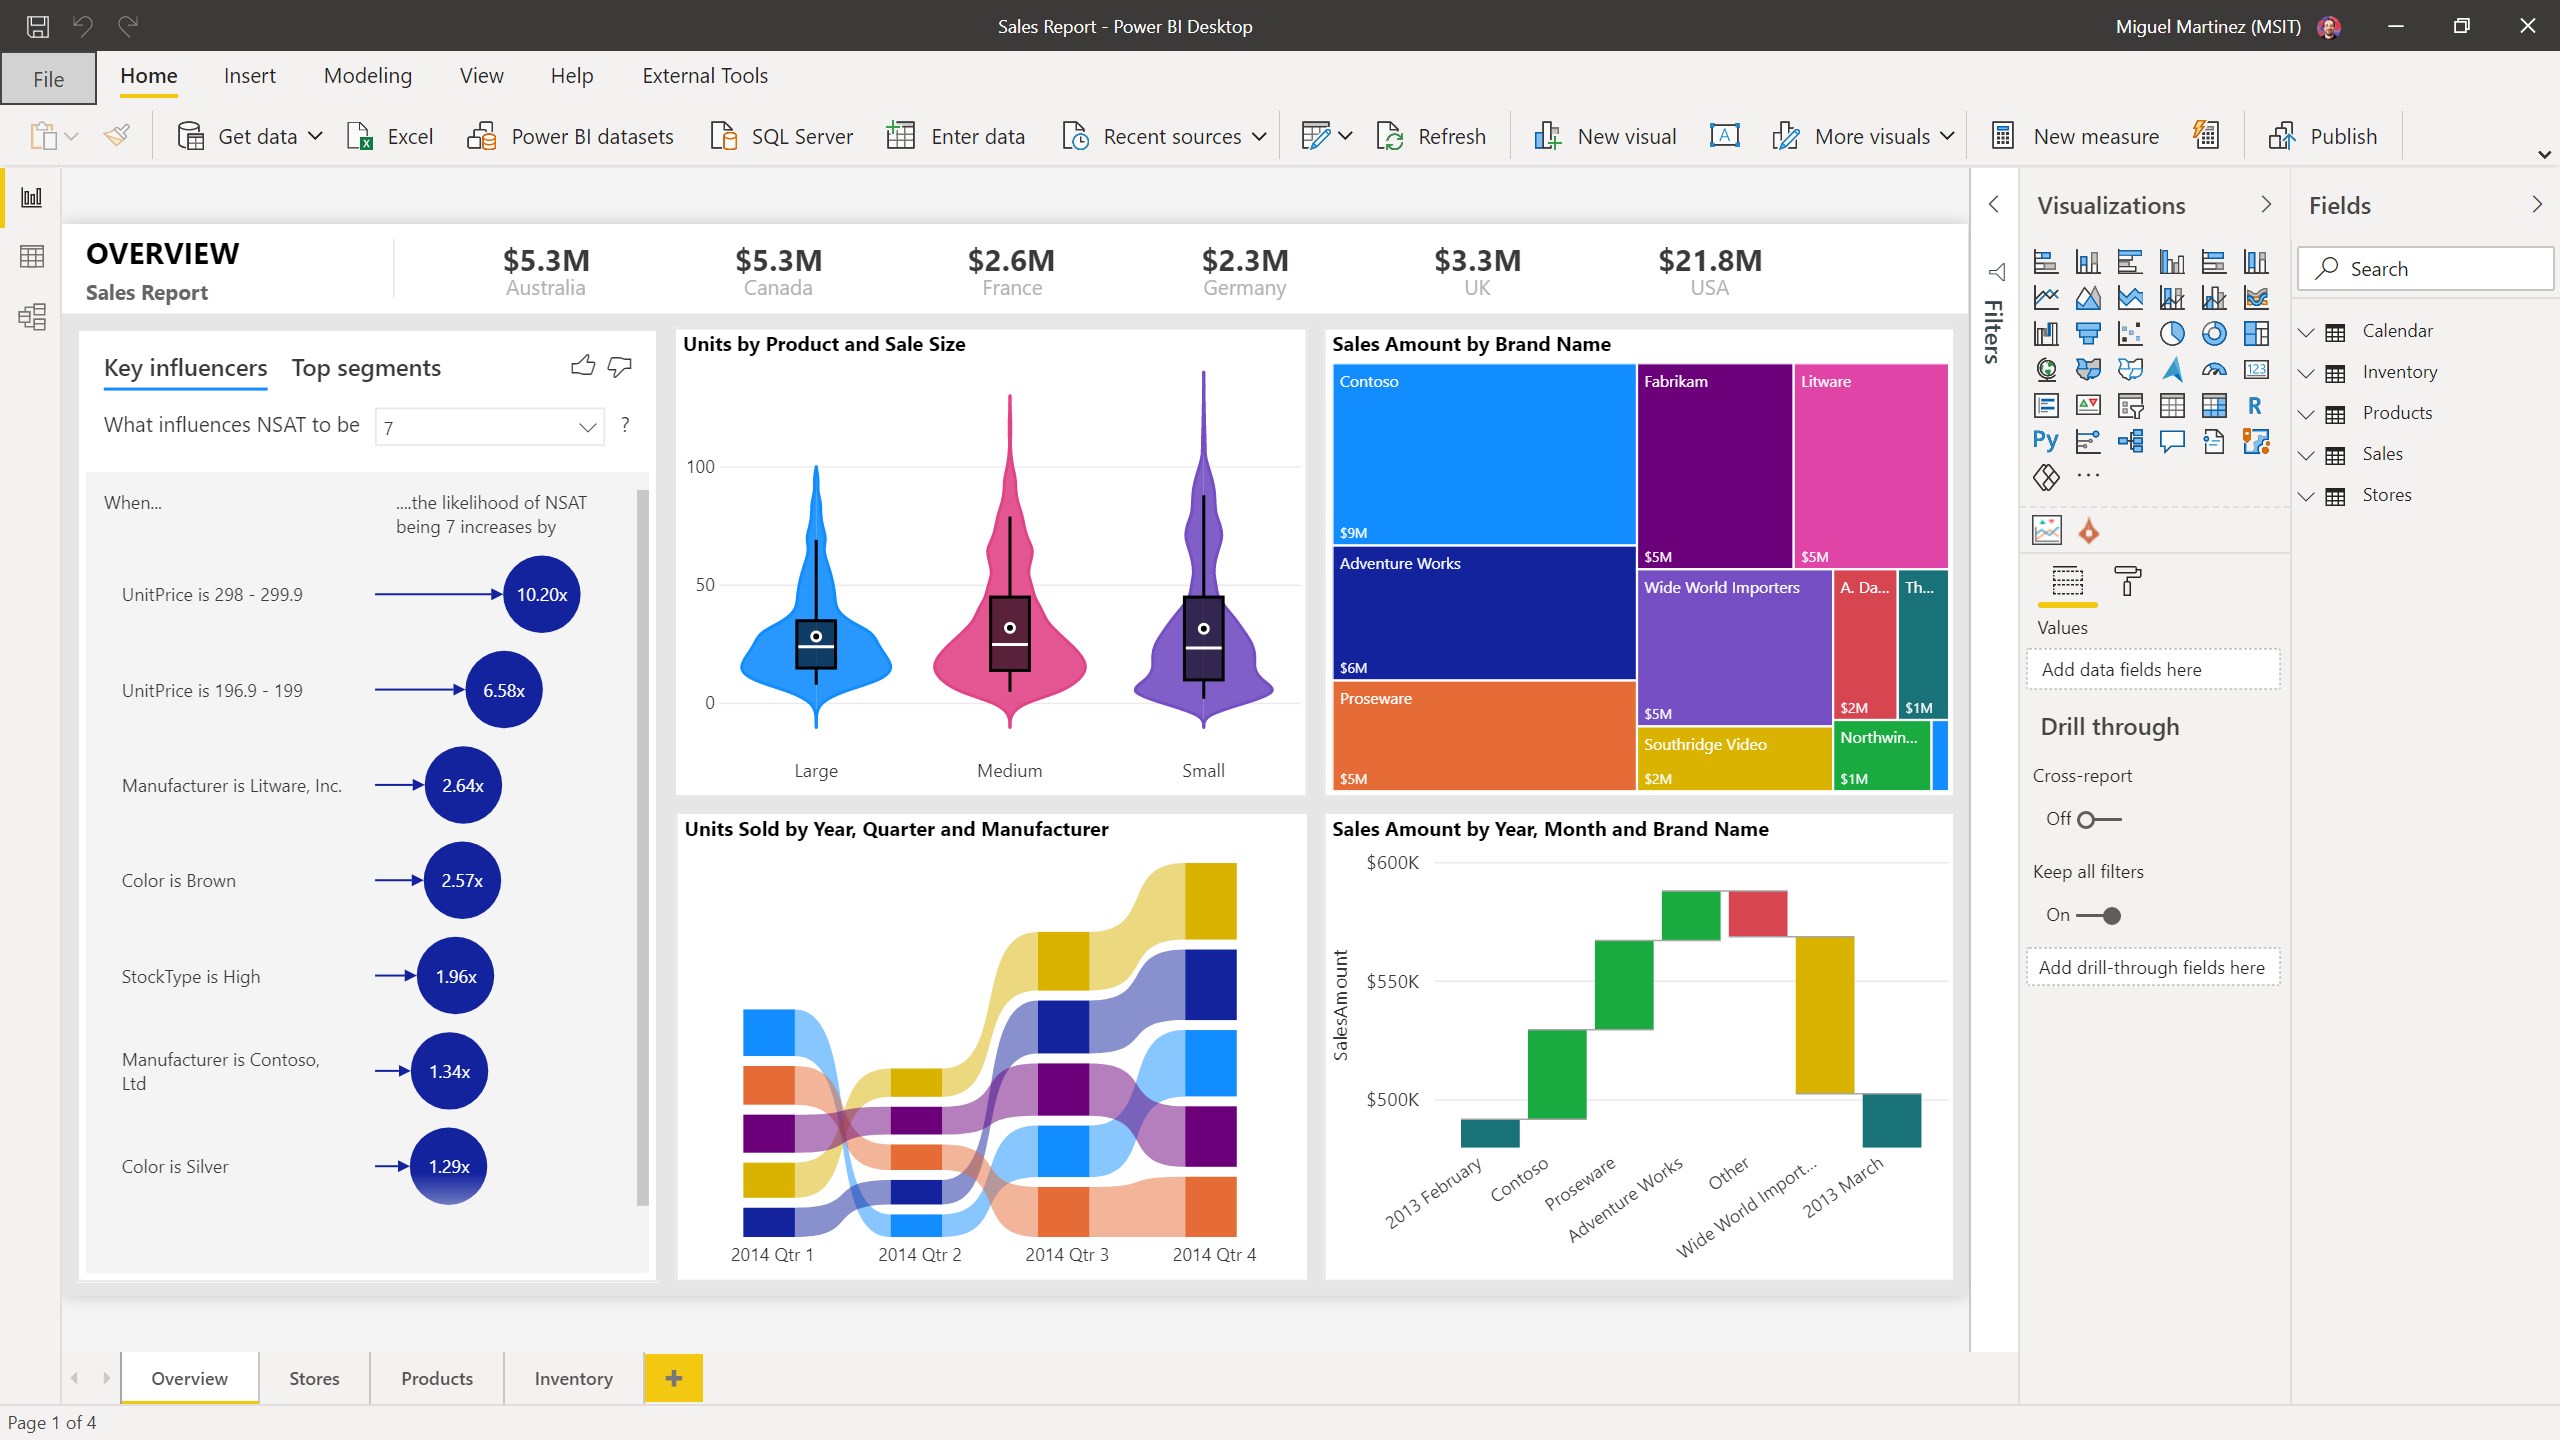
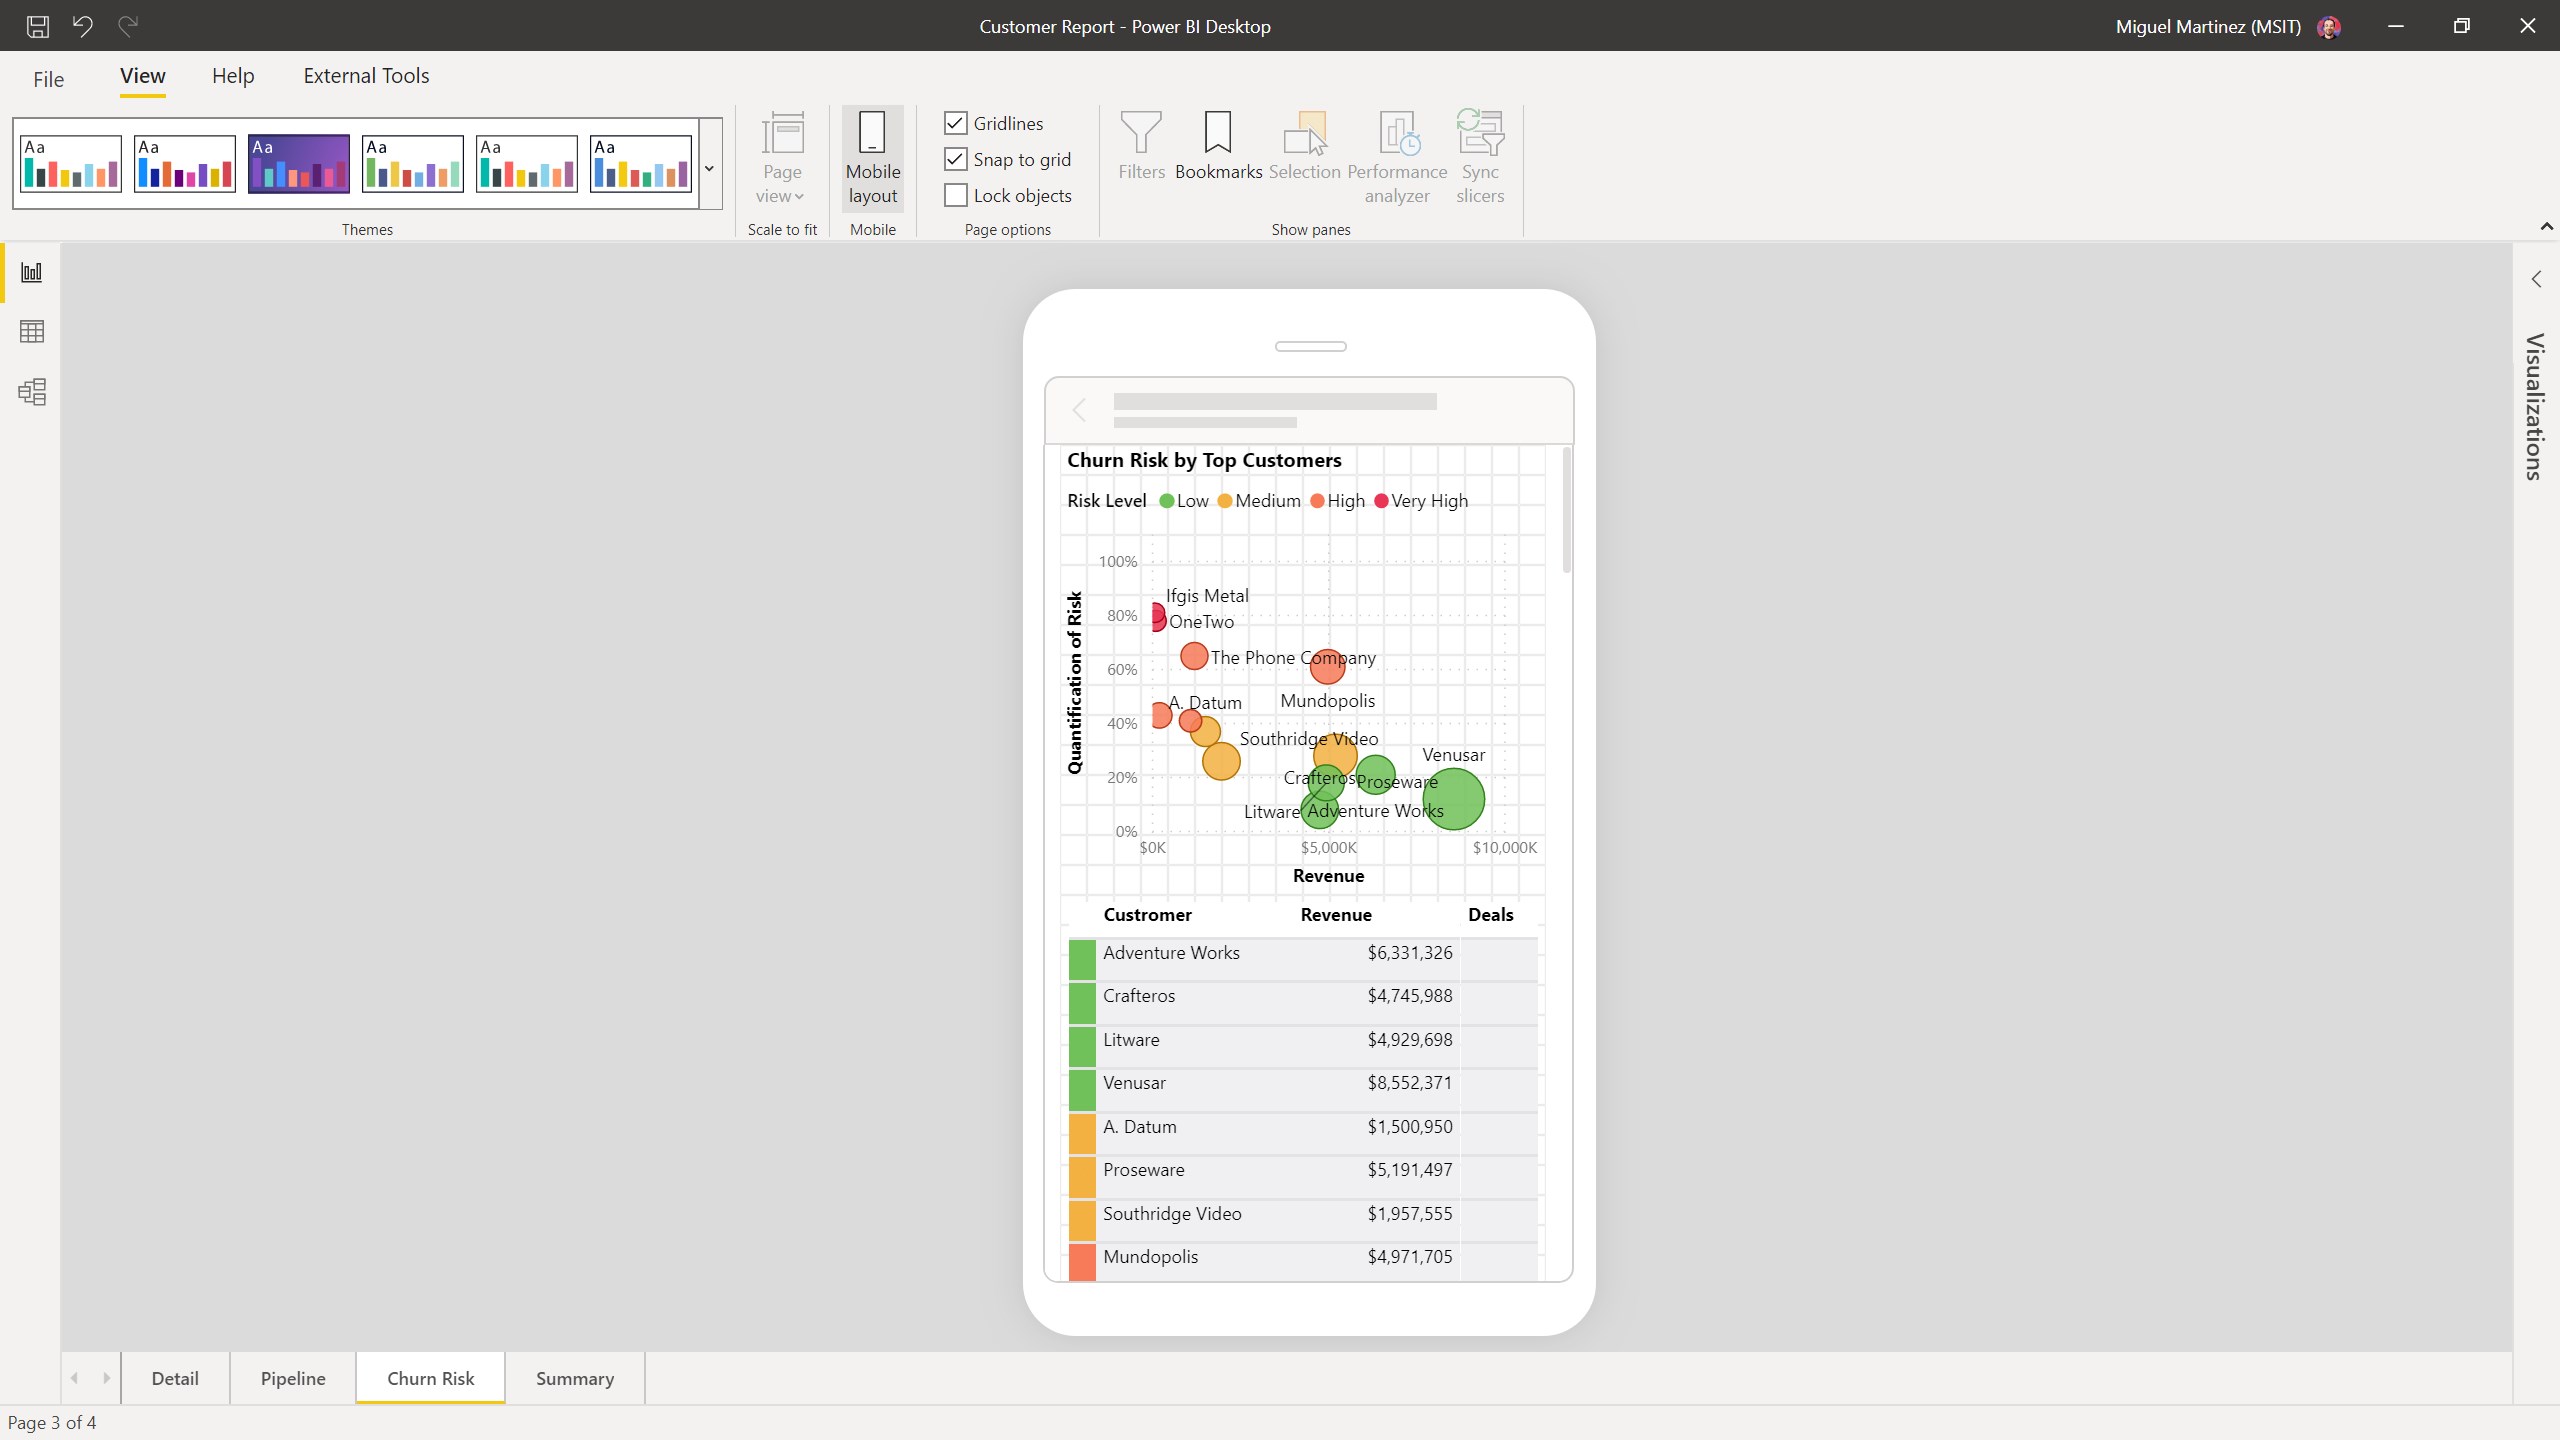
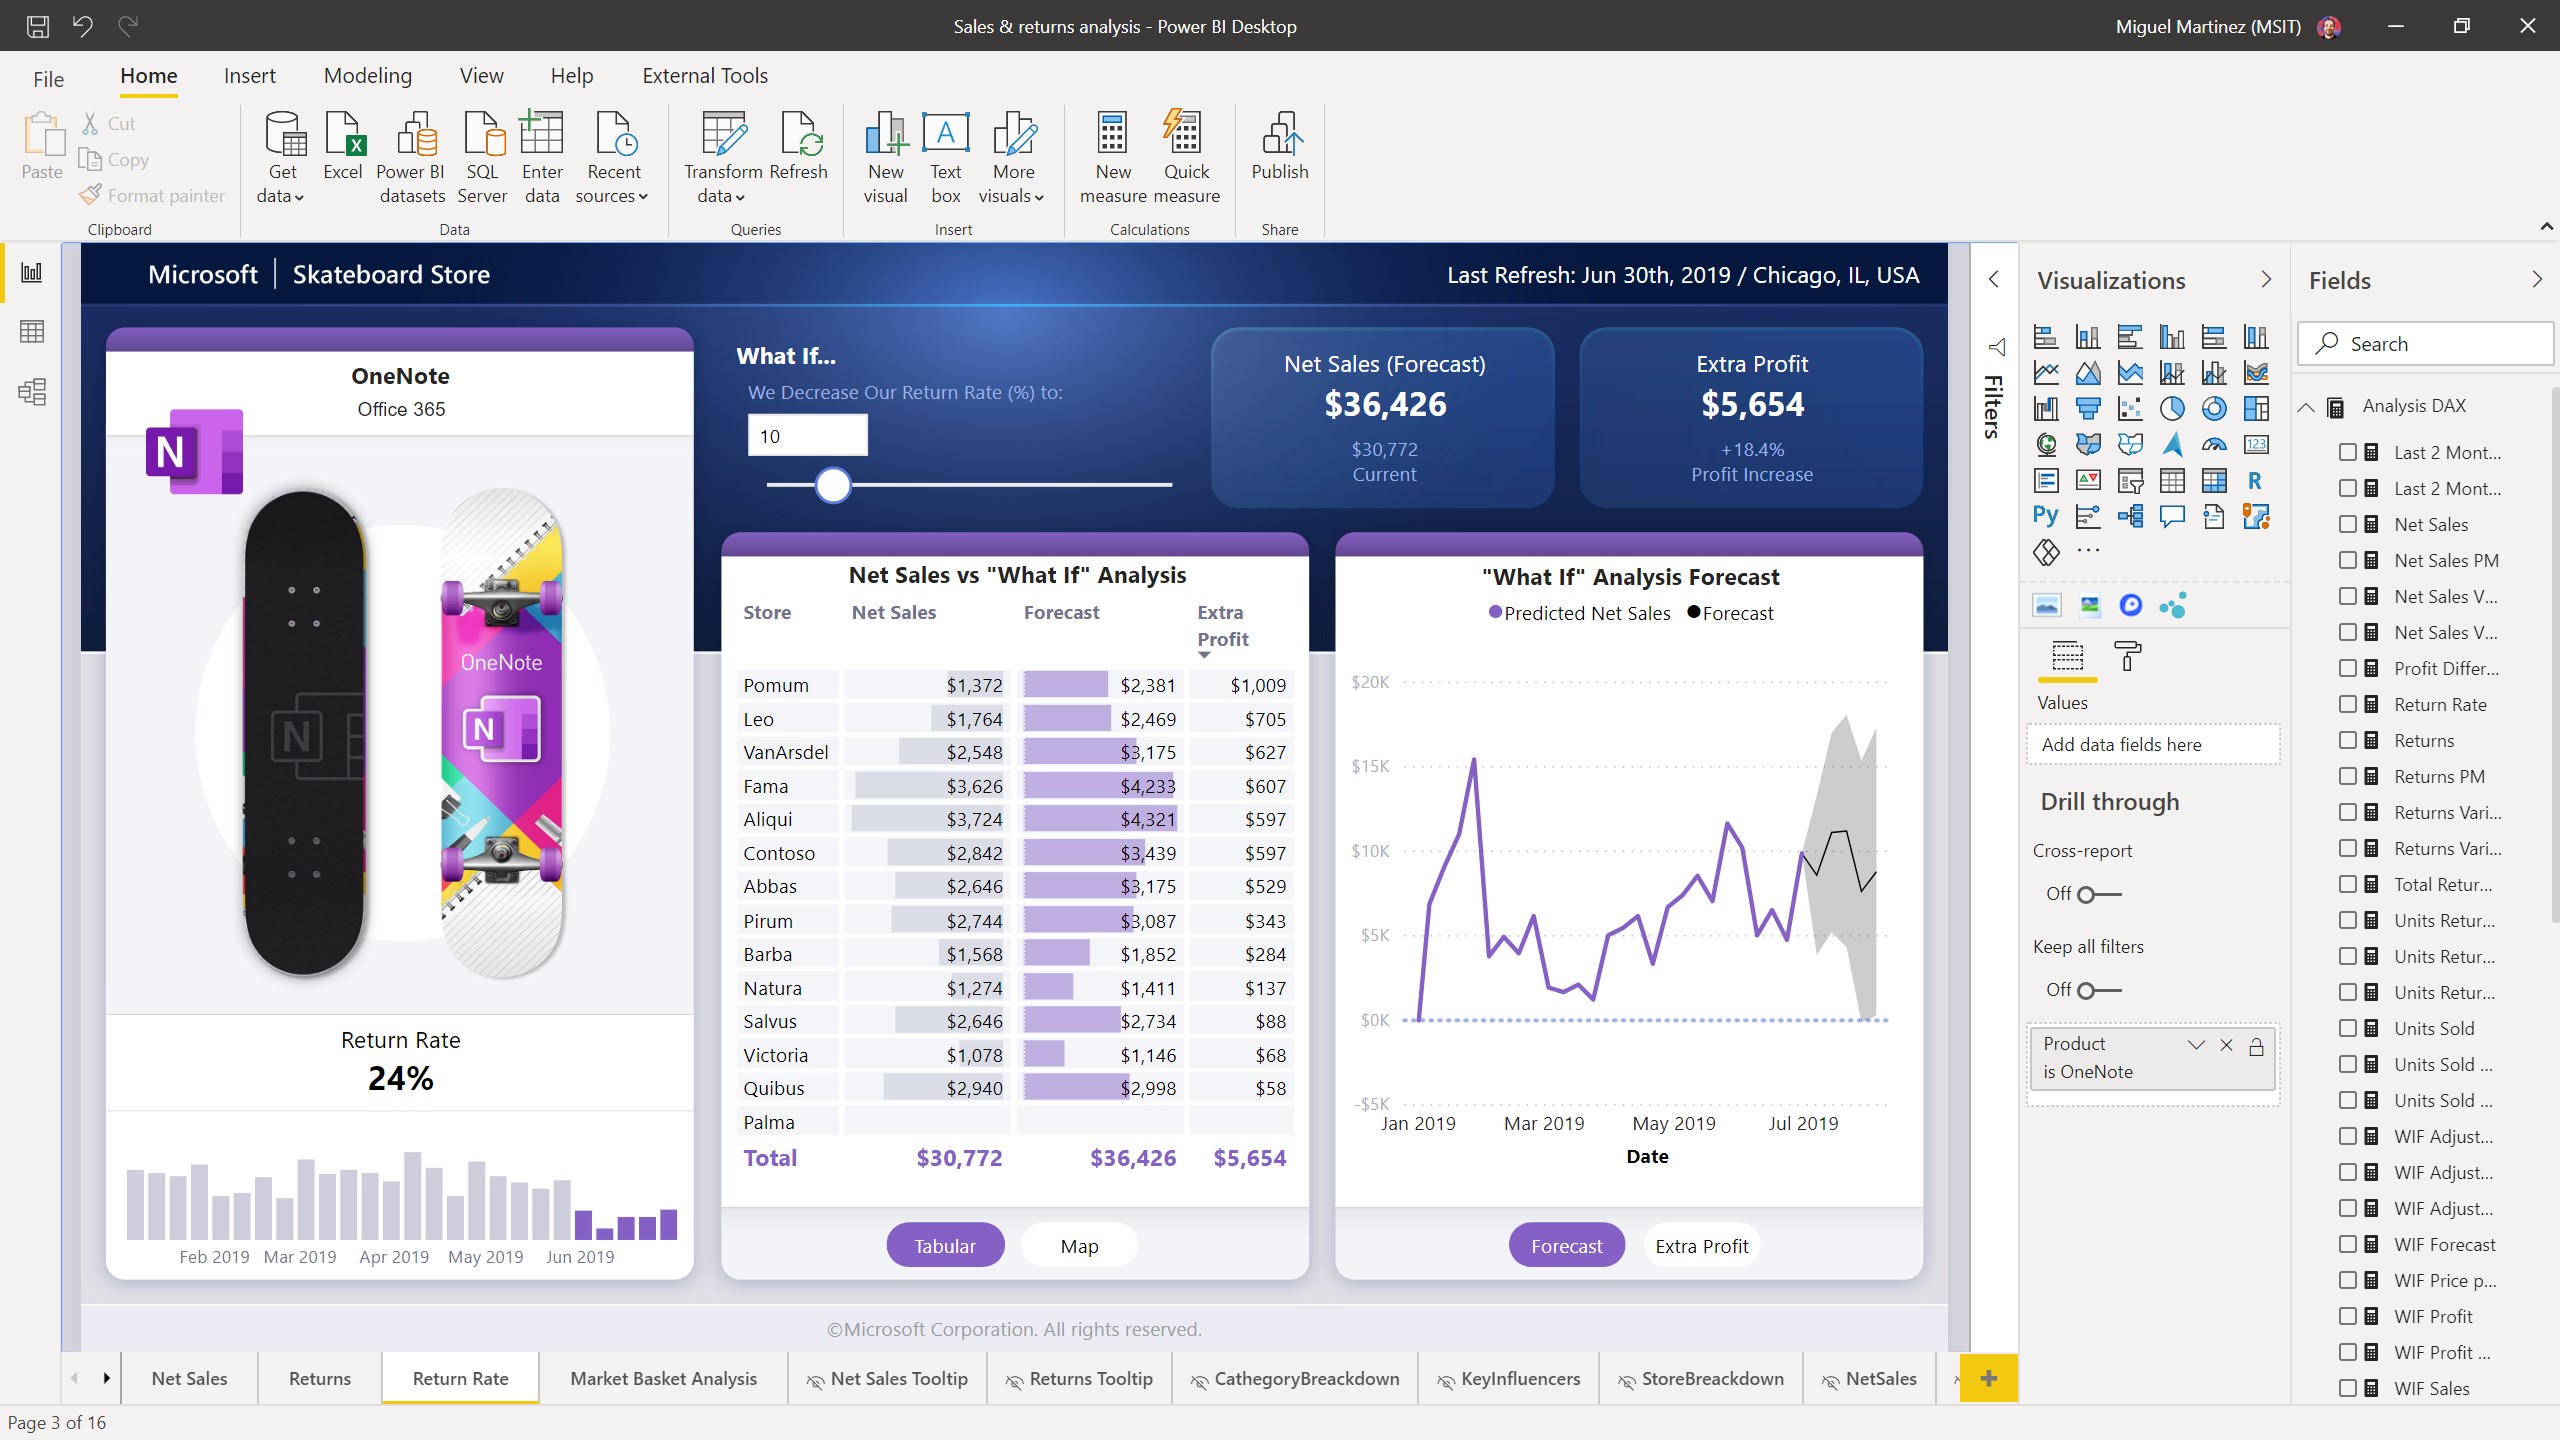
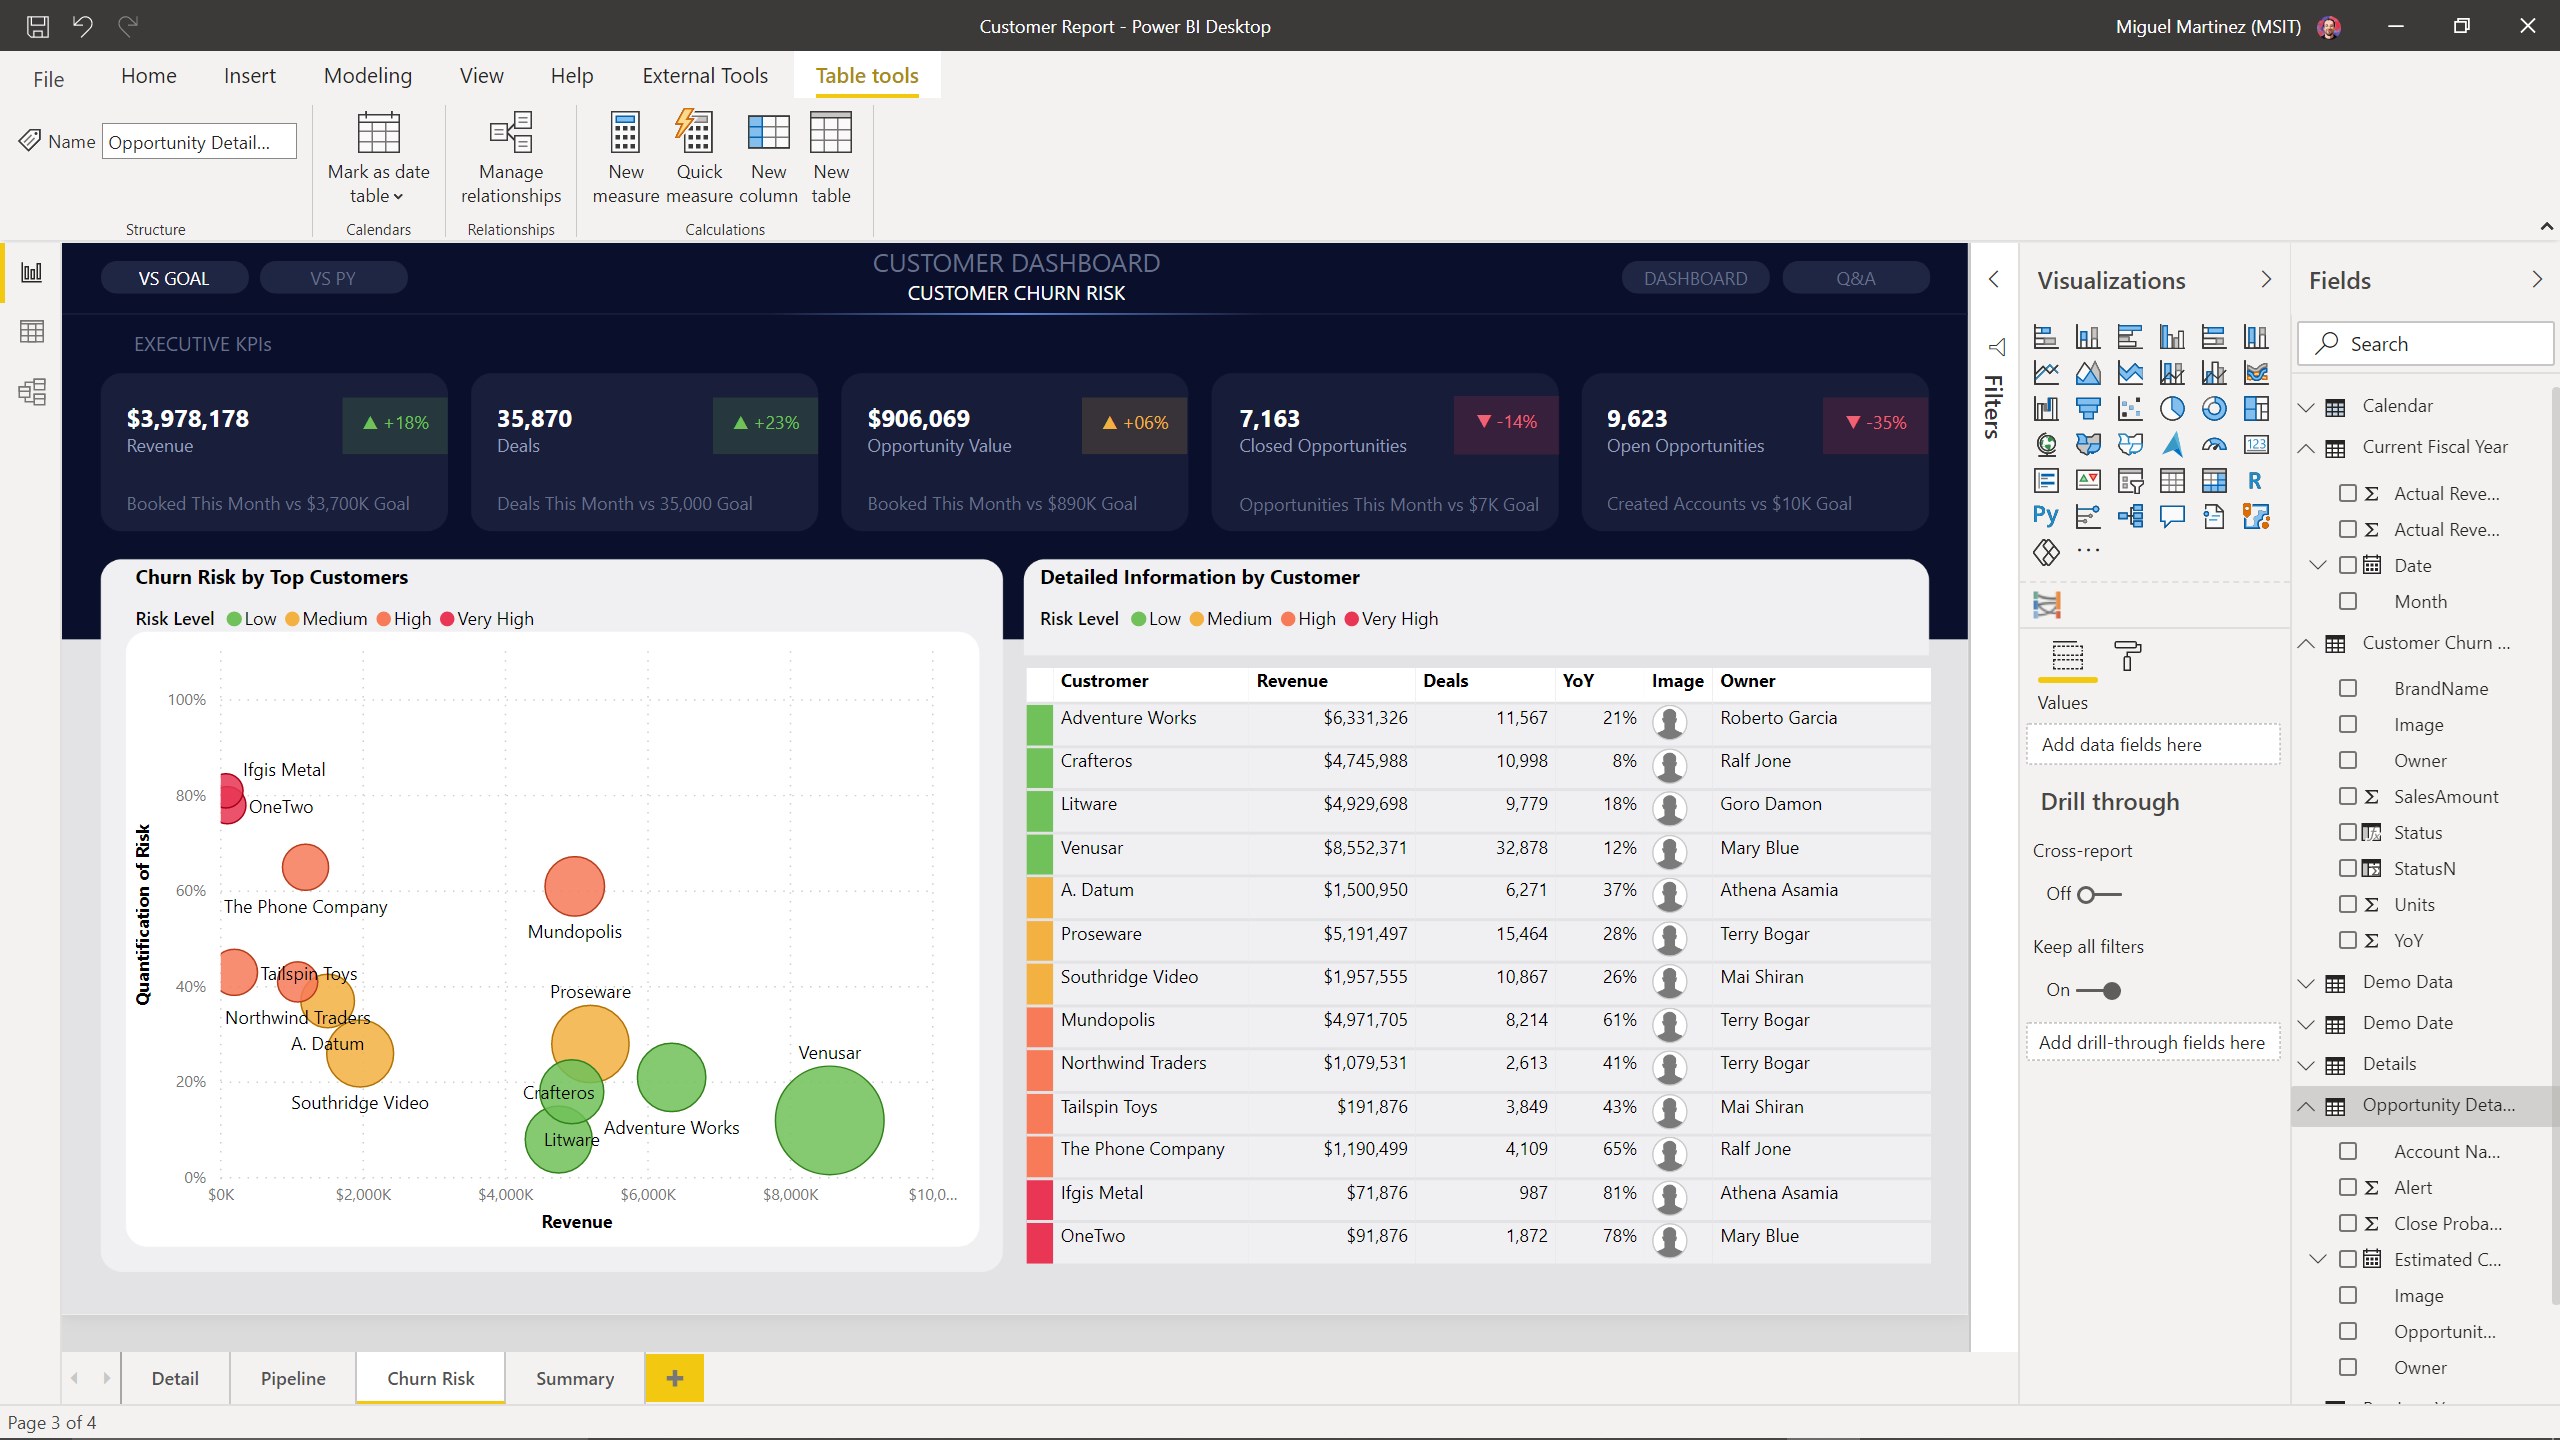
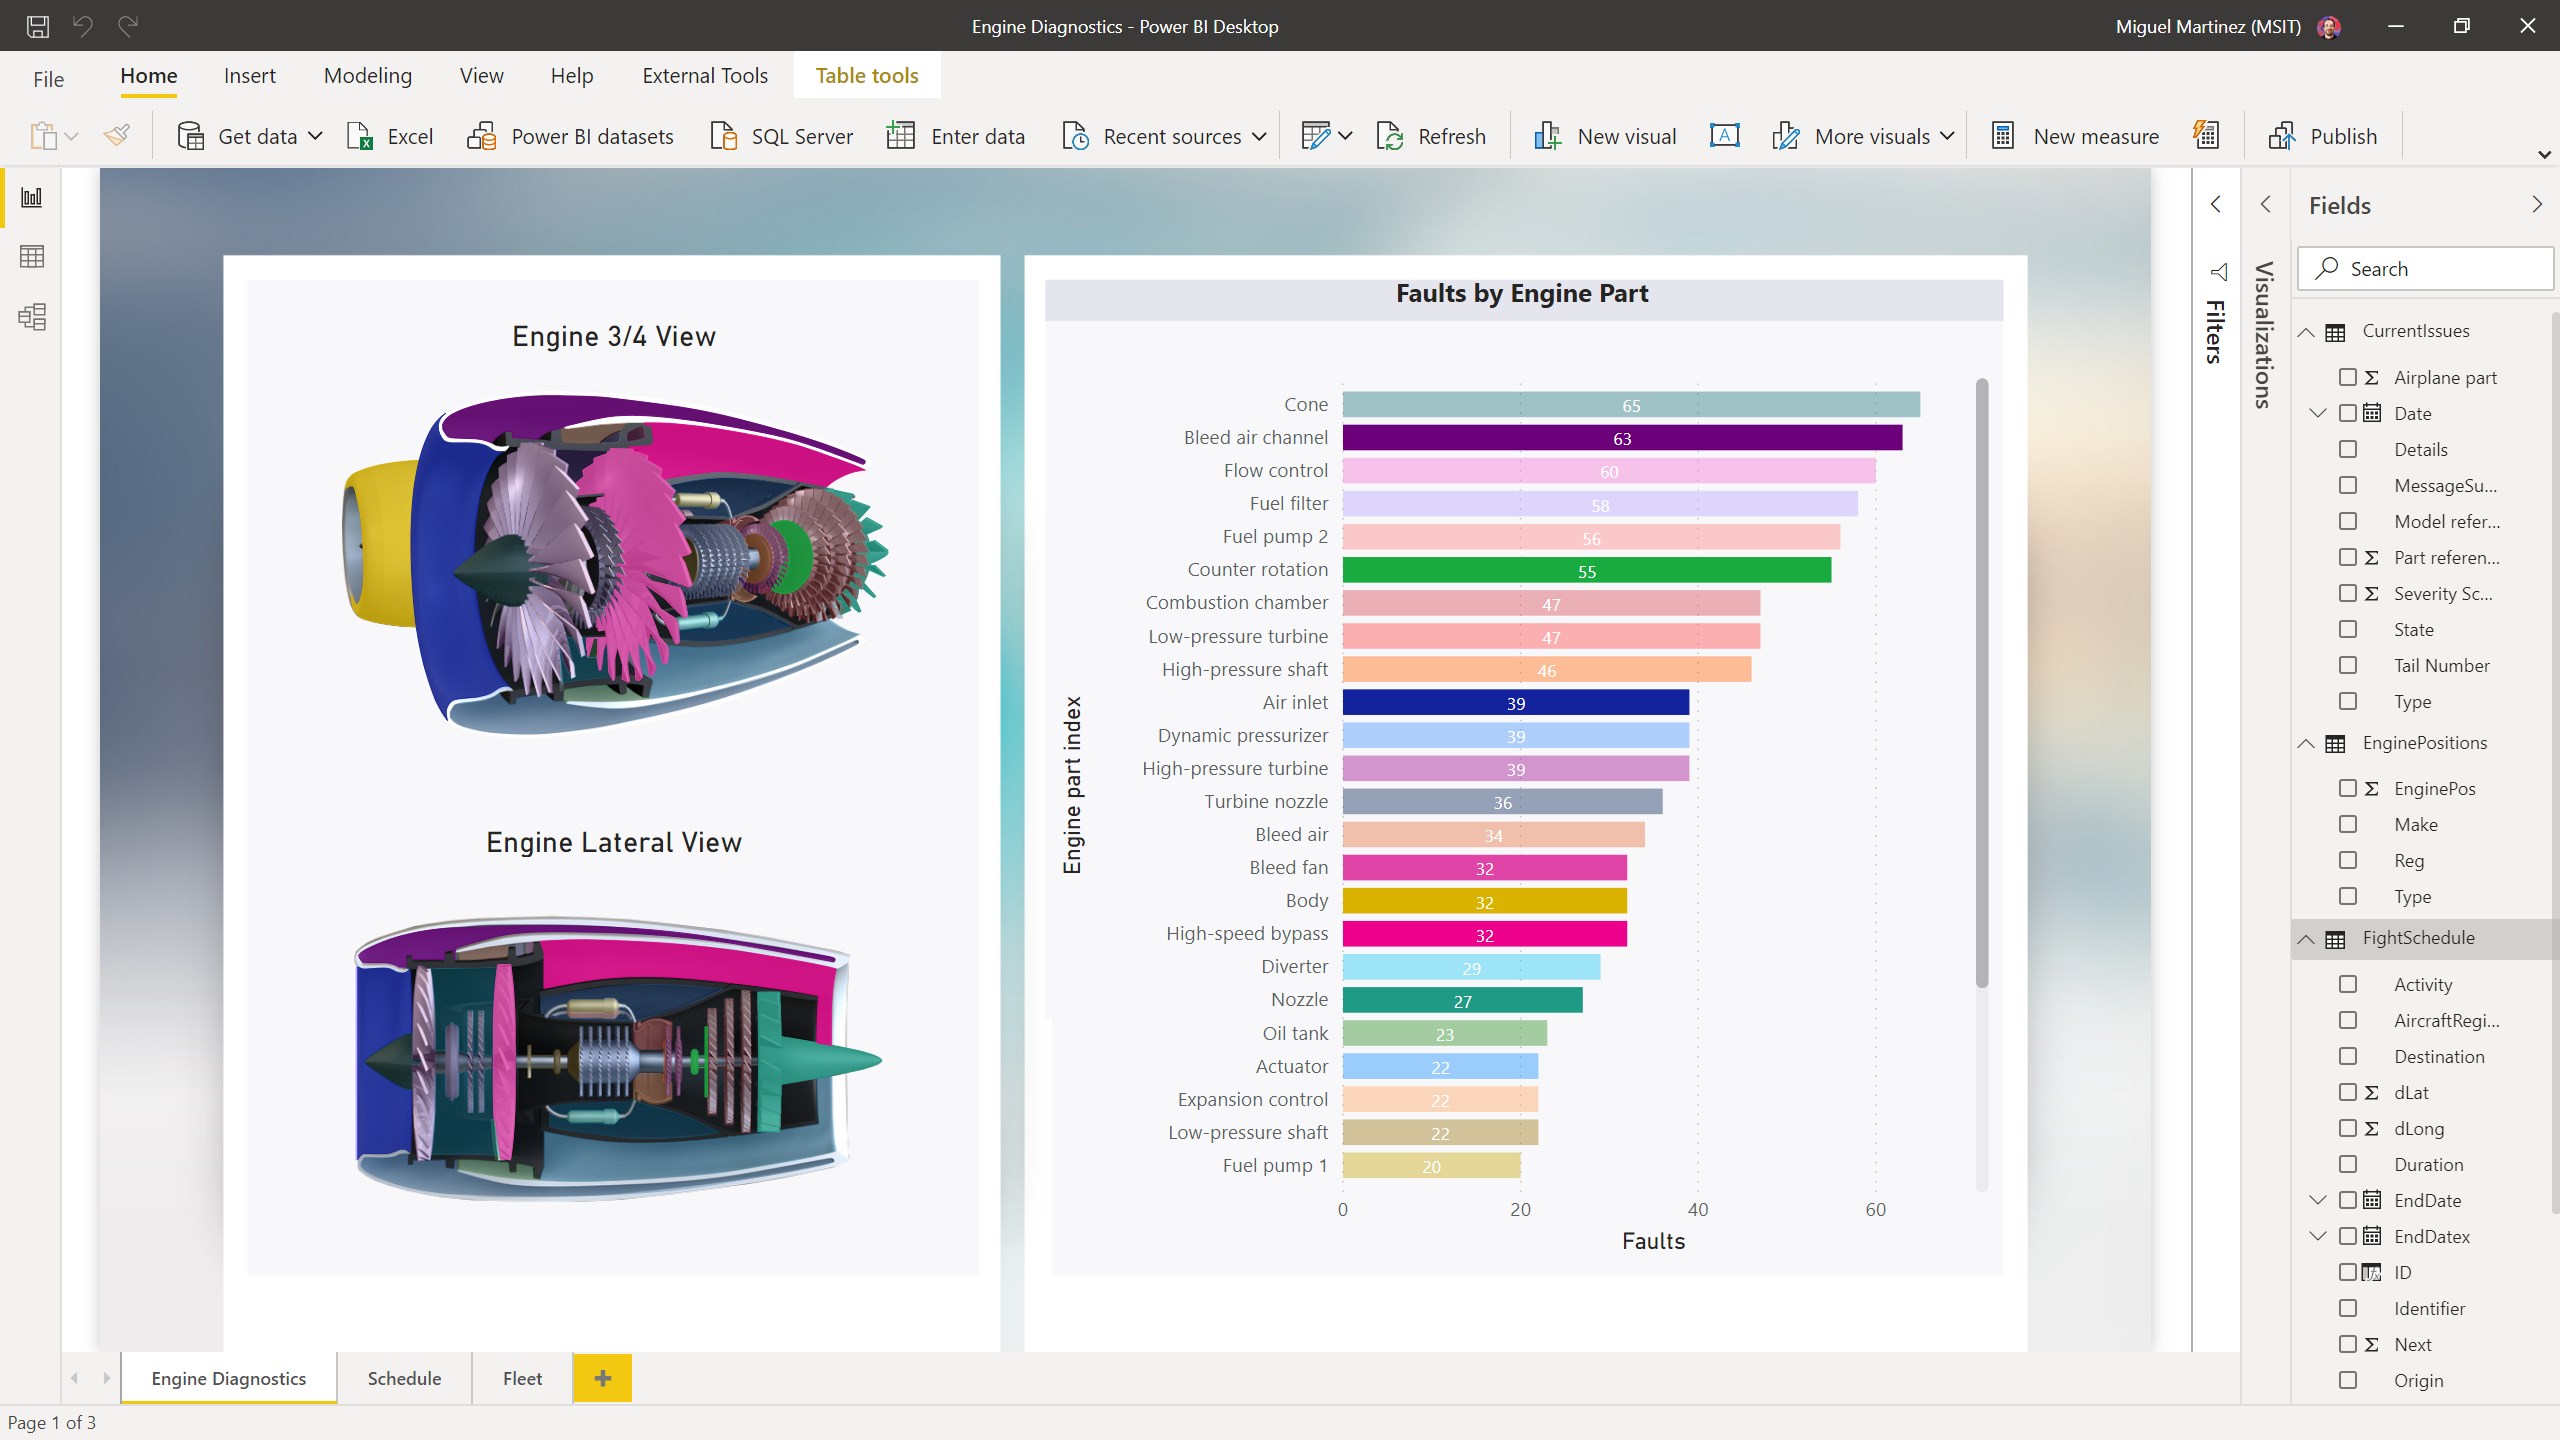
Creating visually appealing dashboards is a breeze with Power BI's diverse library of customizable charts, maps, and gauges. Users can craft dashboards that tell stories with just a few clicks, offering real-time interactivity such as drill-downs and filters. The embedded AI-powered insights further enhance data exploration, making complex patterns instantly comprehensible, much like turning a tangled web into a clear map.
Collaboration and Sharing Capabilities
One of Power BI Desktop's standout features is its seamless integration with the Power BI Service, allowing teams to publish, share, and collaborate on reports effortlessly. It promotes a collaborative approach—think of it as a virtual conference table where multiple analysts can discuss insights, annotate visuals, and update reports in real time, ensuring everyone stays on the same page.
Design & User Experience
The interface is clean, familiar, and reminds users of other Office apps — familiar ribbon menus and drag-and-drop functionalities prevent a steep learning curve. Navigating through data sources, modeling, and report creation feels smooth, akin to driving a well-oiled vehicle on a clear road. Beginners will appreciate the helpful tooltips and built-in tutorials, while experienced users will value the advanced features and customizations.
Core Functionalities in Depth
The most distinctive aspect of Power BI Desktop lies in its dual capacity for both detailed data modeling and advanced visualization. The software's intelligent query editor simplifies complex data preparations, making it possible for non-programmers to clean and organize huge datasets efficiently. Additionally, the AI-infused visuals, like key influencers or anomaly detectors, act like a seasoned guide pointing out hidden insights — this is where Power BI truly differentiates itself from other business reporting tools.
Collaborative Work & Unique Advantages
Compared to competitors, Power BI Desktop's integration with collaborative features is especially compelling. Its task management and sharing capabilities foster a team environment, transforming static reports into dynamic, living documents. Unlike traditional business apps that focus solely on individual analysis, Power BI promotes a collective effort — akin to a group of detectives piecing together clues in a case, with each member adding their perspective seamlessly.
Final Verdict and Recommendations
Overall, Power BI Desktop for Windows earns a strong recommendation for businesses and individual professionals eager to leverage data for insightful decision-making. Its combination of user-friendly design, powerful modeling, and collaborative tools make it stand out in the crowded landscape of business intelligence applications. For those new to data visualization, the learning curve is manageable, especially with Microsoft's community support and tutorials. Advanced users will find its extensive customization options a major plus.
If your goal is to turn complex data into clear, actionable reports while fostering team collaboration, Power BI Desktop is an excellent choice. It's like having a smart, silent partner on your data journey, helping you navigate through information with confidence and clarity.
Pros
- Intuitive Data Visualization
- Seamless Integration with Microsoft Ecosystem
- Robust Data Modeling Capabilities
- Strong Query Performance
- Regular Updates and New Features
Cons
- Steep Learning Curve for Beginners
- Limited Support for Non-Microsoft Data Sources
- Performance Issues with Large Datasets
- Requires Powerful Hardware for Optimal Use
- Limited Offline Functionality